Skip to content

QubitSage Chronicles

“Eternally curious (Jigyasu) woman in tech — QubitSage of the digital-verse, learning, sharing, and leaping across spacetime continuums, one insight at a time…”

  • Home
  • LinkedIn
  • Twitter
  • Poetries

Category: Dashboard

  • Home
  • Dashboard
No script editor installed? Want to style your page? No Problem!

No script editor installed? Want to style your page? No Problem!

  • Code
  • CSS
  • Dashboard
  • JavaScript
  • Office 365
  • SharePoint
  • SharePoint UserGroups
  • Tips and tricks

As the old adage goes “Where there is will there is way!”, “Necessity is the mother of invention.”, or as…

  • Swetha Sankaran
  • July 13, 2017
  • 8 min read
  • 0
Popularity Trends in  #Office365 #SharePoint Online

Popularity Trends in #Office365 #SharePoint Online

  • Dashboard
  • Office 365
  • Reporting Solution
  • SharePoint

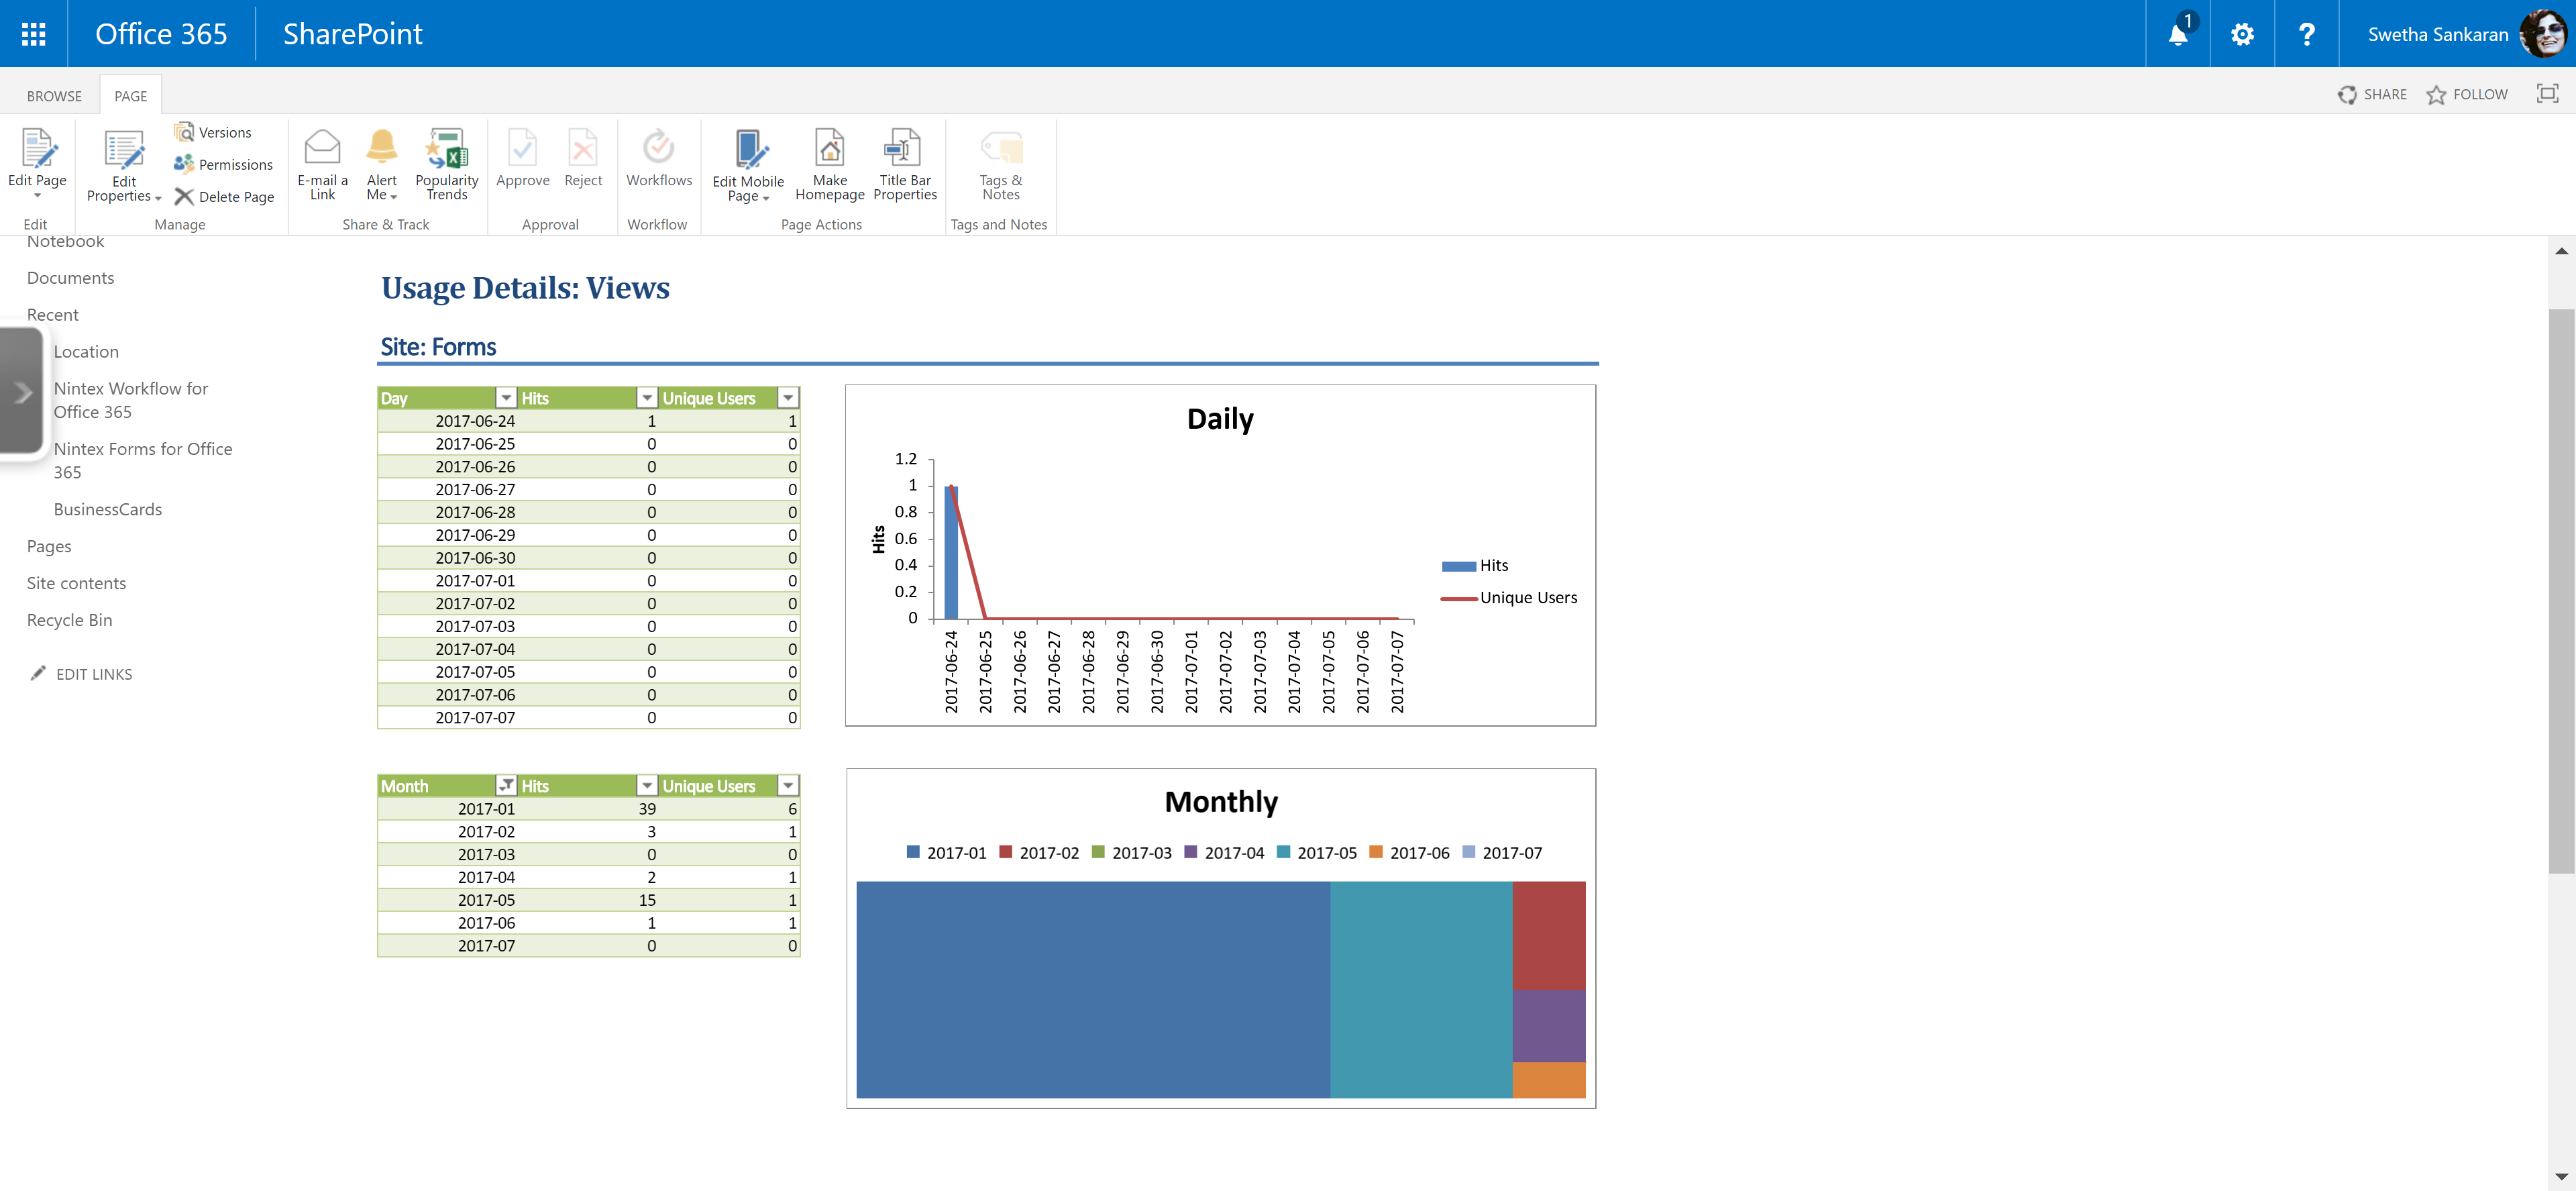
Once you setup a site and it starts getting traffic there would come a time when you get curious as…

  • Swetha Sankaran
  • July 8, 2017
  • 2 min read
  • 0
Dashboard solution for SharePoint Online using HighCharts, custom views, KPI columns and Nintex for Office 365 apps

Dashboard solution for SharePoint Online using HighCharts, custom views, KPI columns and Nintex for Office 365 apps

  • Custom App
  • Dashboard
  • HighCharts
  • Nintex
  • Nintex Connect
  • Nintex forms for Office 365
  • Nintex workflow for Office 365
  • Office 365
  • Reporting Solution
  • SharePoint
  • SharePoint UserGroups
  • Talks

Session topic: Dashboard solution for SharePoint Online using HighCharts, custom views, KPI columns and Nintex for Office 365 apps. “Your…

  • Swetha Sankaran
  • July 20, 2015
  • 2 min read
  • 0

Color your SharePoint Online list rows with KPI

  • Code
  • CSS
  • Dashboard
  • JavaScript
  • Office 365
  • SharePoint
  • SharePoint Designer

Tiny nugget of code that goes a lonngggg way. Why? Cause everyone likes pretty colors. What? You don’t? Well, I most…

  • Swetha Sankaran
  • May 6, 2015
  • 2 min read
  • 1

Dashboard with PivotTable in Sharepoint 2010

  • Dashboard
  • Reporting Solution
  • SharePoint

Here is a great idea for dashboards for SharePoint 2010 tasks list or any list for that matter. http://blog.netnerds.net/2012/03/sharepoint-2010-creating-dashboards-and-charts-for-sharepoint-lists-using-performancepoint-and-excel-services/

  • Swetha Sankaran
  • April 17, 2013
  • 1 min read
  • 0

Business Intelligence Demos

  • Dashboard
  • Reporting Solution

Here is a list of Microsoft BI Demos. http://smartdatacollective.com/Home/18178 Have fun BIing!

  • Swetha Sankaran
  • January 14, 2011
  • 1 min read
  • 0

Posts pagination

1 2 Next
January 2026
M T W T F S S
 1234
567891011
12131415161718
19202122232425
262728293031  
« Oct    

MIT AI News

  • Decoding the Arctic to predict winter weather
  • Stone Center on Inequality and Shaping the Future of Work Launches at MIT
  • MIT scientists investigate memorization risk in the age of clinical AI
  • Using design to interpret the past and envision the future
  • MIT in the media: 2025 in review

Microsoft Quantum Blog

  • Quantum-safe security: Progress towards next-generation cryptography
  • Microsoft advances quantum error correction with a family of novel four-dimensional codes
  • Transforming R&D with agentic AI: Introducing Microsoft Discovery
  • Microsoft unveils Majorana 1, the world’s first quantum processor powered by topological qubits
  • 2025: The year to become Quantum-Ready

Waterloo Institute of Quantum Computing

  • Celebrating the Institute for Quantum Computing's year of impact and collaboration
  • Quantum computers learn how to simulate quarks
  • IQC doctoral student wins prestigious scholarship
  • Rising stars of quantum information research connect at IQC
  • Connecting Canada’s North with a quantum sensing system
Copyright © 2026 QubitSage Chronicles
 

Loading Comments...